
 Image 1 of 2
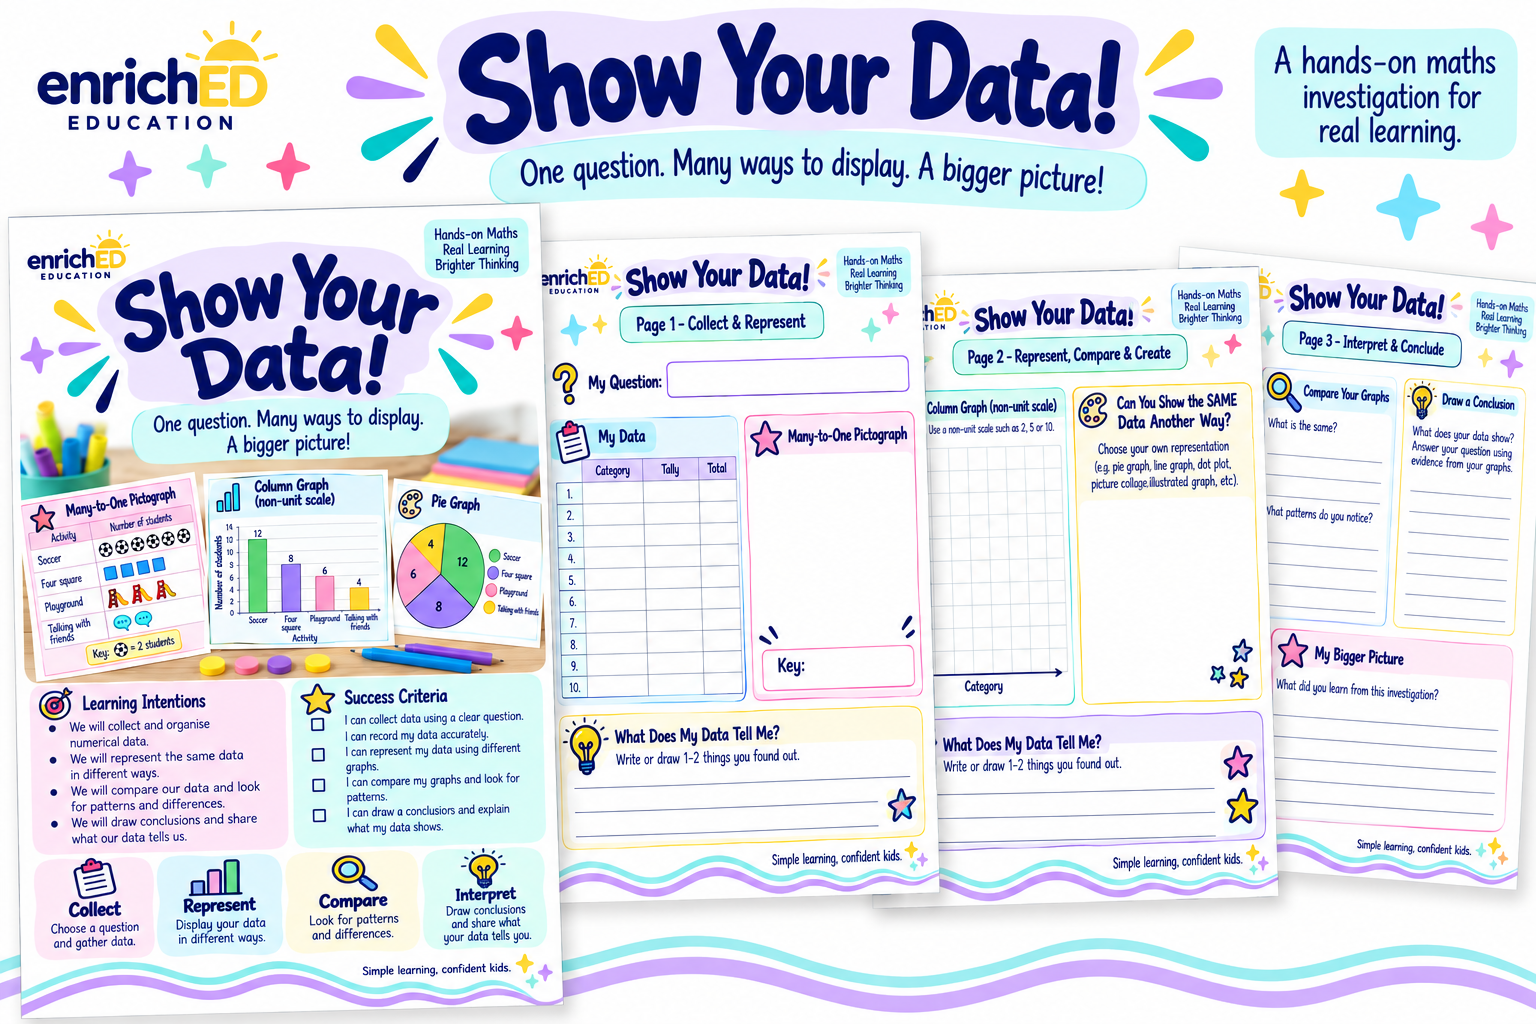 Image 2 of 2
An open-ended maths investigation that helps students collect, represent, compare and interpret data.
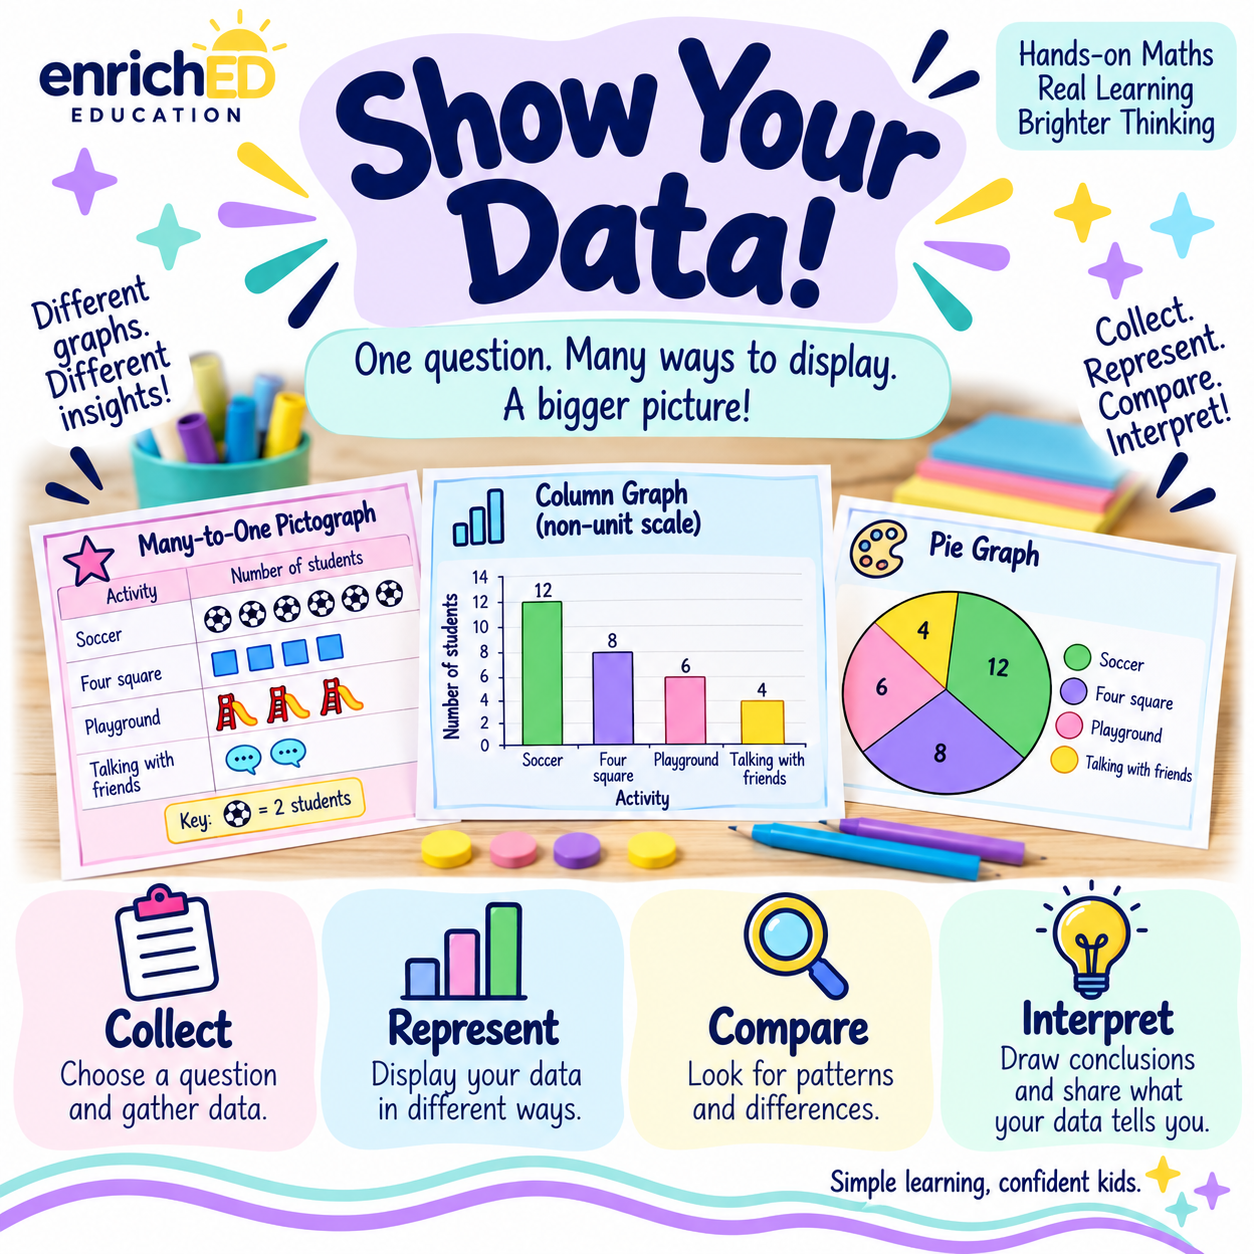
Students begin with their own question and collect categorical data before representing the same dataset in different ways. They create a many-to-one pictograph and a column graph using a non-unit scale, then choose another representation to show their data in a different way. Students compare their representations, identify what the data tells them and draw conclusions.
Students will:
pose a question and collect categorical data
organise data using tallies and totals
create a many-to-one pictograph using an appropriate key
create a column graph using a non-unit scale
represent the same data in different ways
compare representations and identify patterns
interpret data and draw conclusions
What’s included:
worked example using one dataset represented in multiple ways
data collection table
many-to-one pictograph activity
non-unit scale column graph
open-ended alternative data representation
data interpretation and reflection prompts
colour student worksheets
printer-friendly black-and-white worksheets
5-page printable PDF digital download.
An open-ended maths investigation that helps students collect, represent, compare and interpret data.
Students begin with their own question and collect categorical data before representing the same dataset in different ways. They create a many-to-one pictograph and a column graph using a non-unit scale, then choose another representation to show their data in a different way. Students compare their representations, identify what the data tells them and draw conclusions.
Students will:
pose a question and collect categorical data
organise data using tallies and totals
create a many-to-one pictograph using an appropriate key
create a column graph using a non-unit scale
represent the same data in different ways
compare representations and identify patterns
interpret data and draw conclusions
What’s included:
worked example using one dataset represented in multiple ways
data collection table
many-to-one pictograph activity
non-unit scale column graph
open-ended alternative data representation
data interpretation and reflection prompts
colour student worksheets
printer-friendly black-and-white worksheets
5-page printable PDF digital download.