
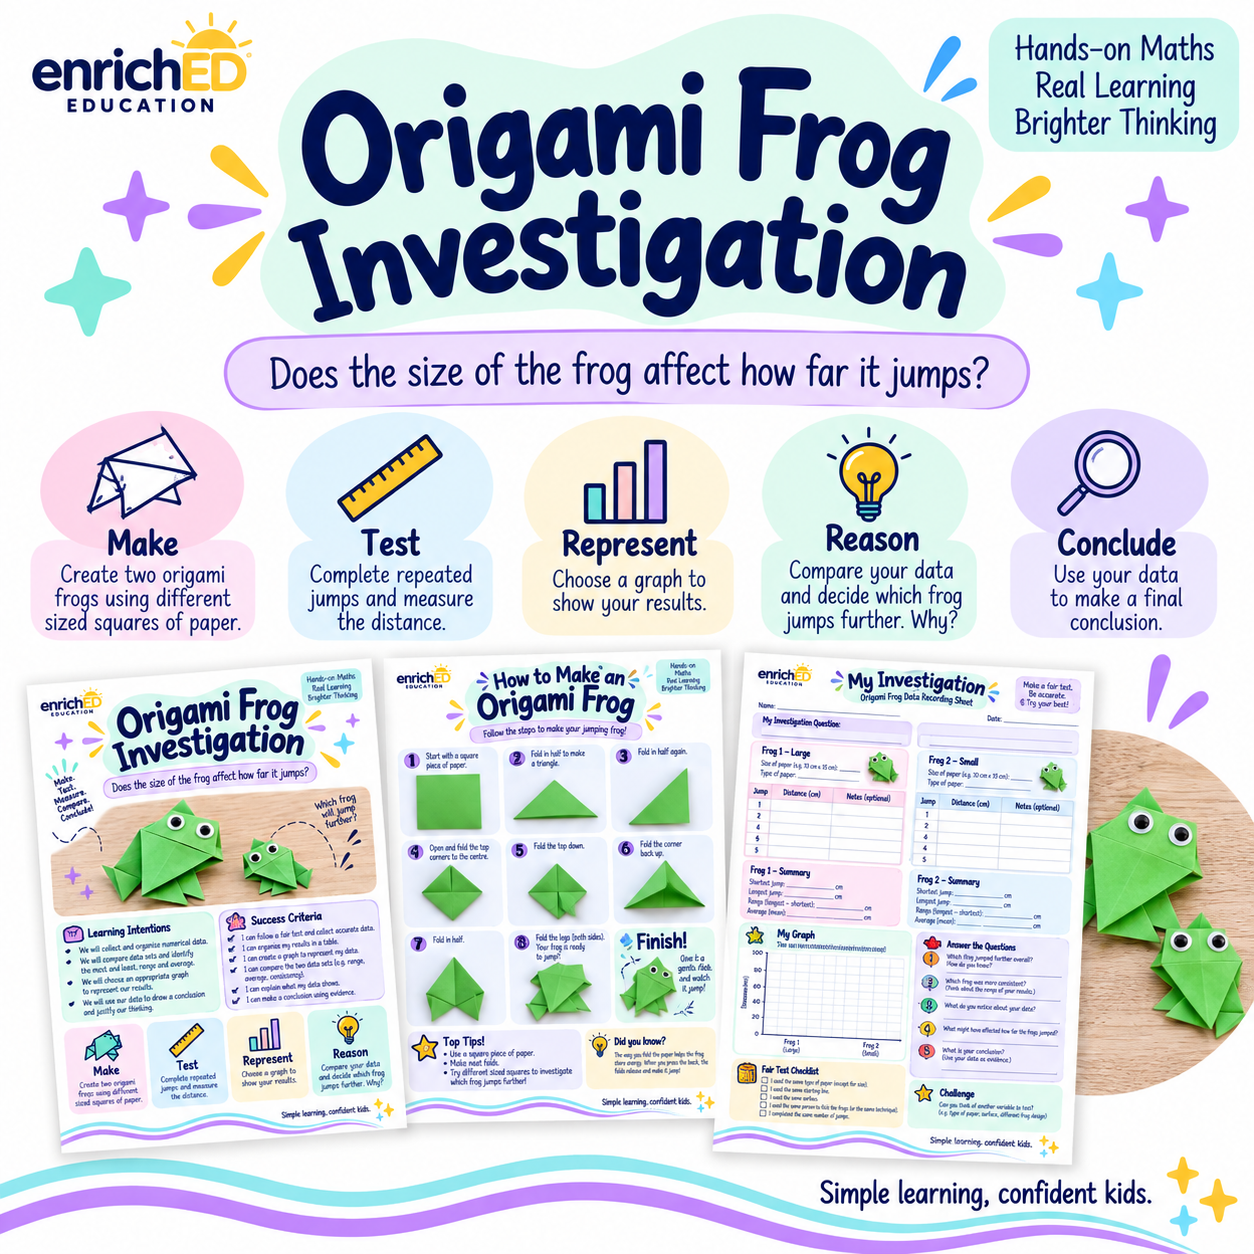
A hands-on maths investigation that gets students making, testing, measuring and reasoning.
Students create two different-sized origami frogs and investigate whether the size of the frog affects how far it jumps. They collect and record data, represent their results using a graph, analyse patterns and use evidence to draw a conclusion.
Students will:
conduct a fair test
measure and record jump distances
organise and represent data
analyse results and identify patterns
justify a conclusion using evidence
What's included:
Learning Intention and Success Criteria
investigation overview and instructions
step-by-step origami frog instructions
data collection and recording table
graphing activity
analysis and reasoning questions
extension challenge
4-page printable PDF digital download.
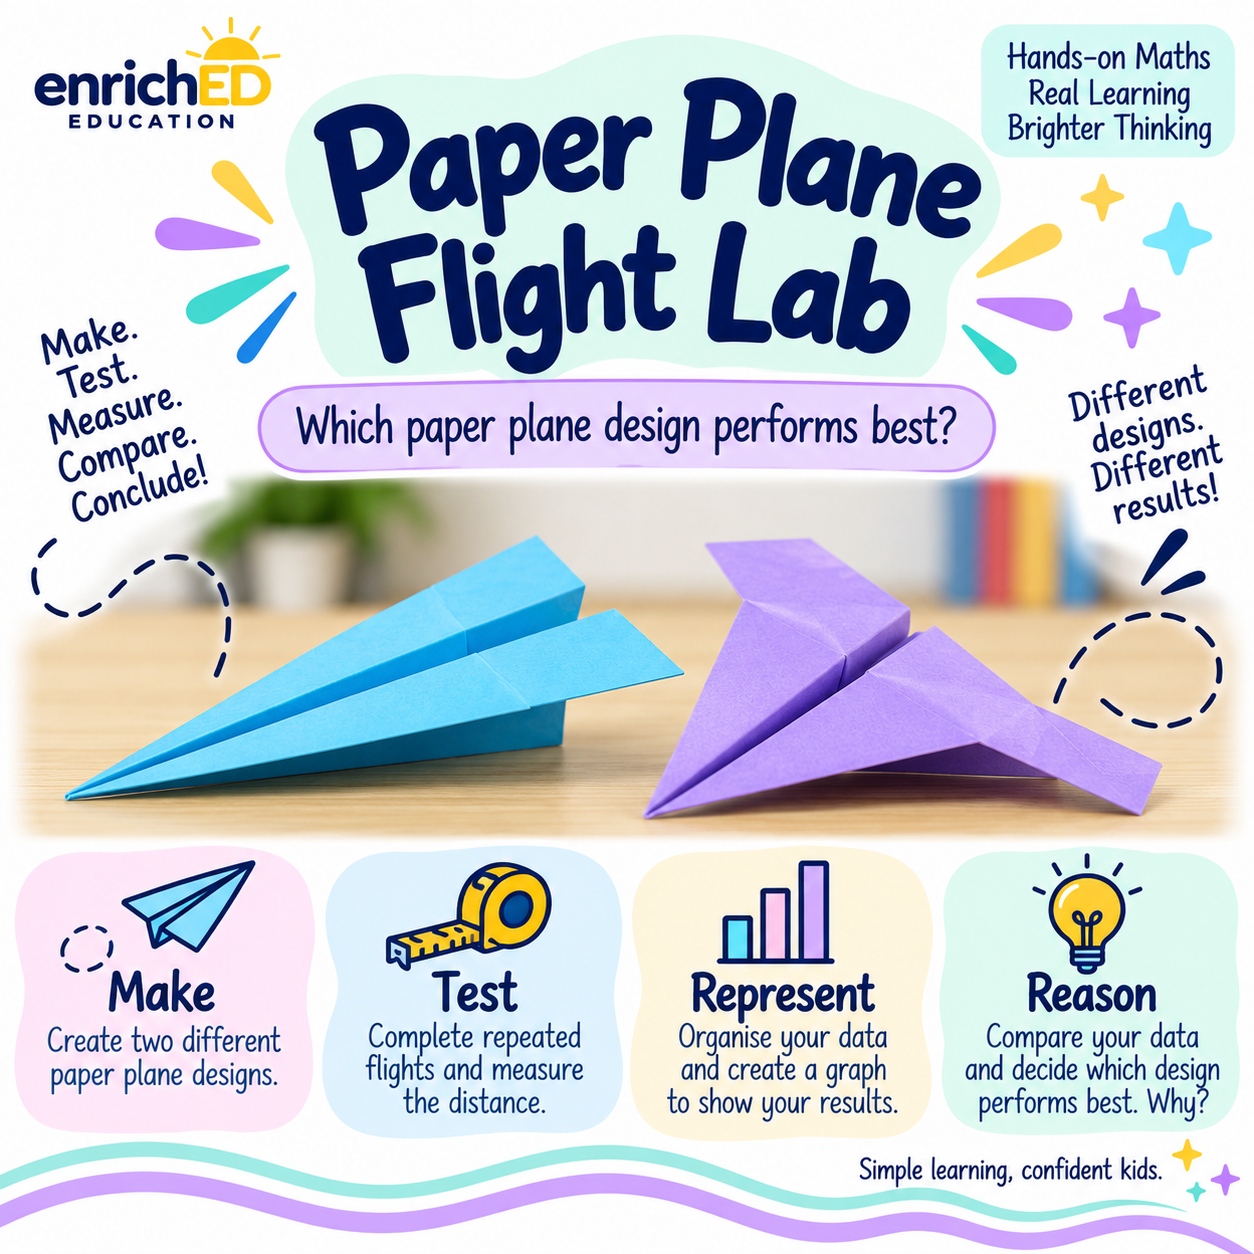
A hands-on maths investigation that gets students making, testing, measuring and reasoning.
Students create two different paper plane designs — the Classic Dart and the Glider — and investigate which design performs best. They conduct repeated flight tests, measure and record distances, represent their results using graphs, compare the data and use evidence to make a recommendation.
Students will:
conduct a fair test
measure and record flight distances
calculate and compare range and average
organise and represent data using graphs
identify patterns, variation and consistency
draw conclusions and justify their thinking using evidence
What’s included:
Learning Intentions and Success Criteria
step-by-step instructions for two paper plane designs
flight testing and data recording tables
fair test checklist and measuring instructions
graphing activities
comparison and analysis questions
recommendation task
extension challenge
4-page printable PDF digital download.
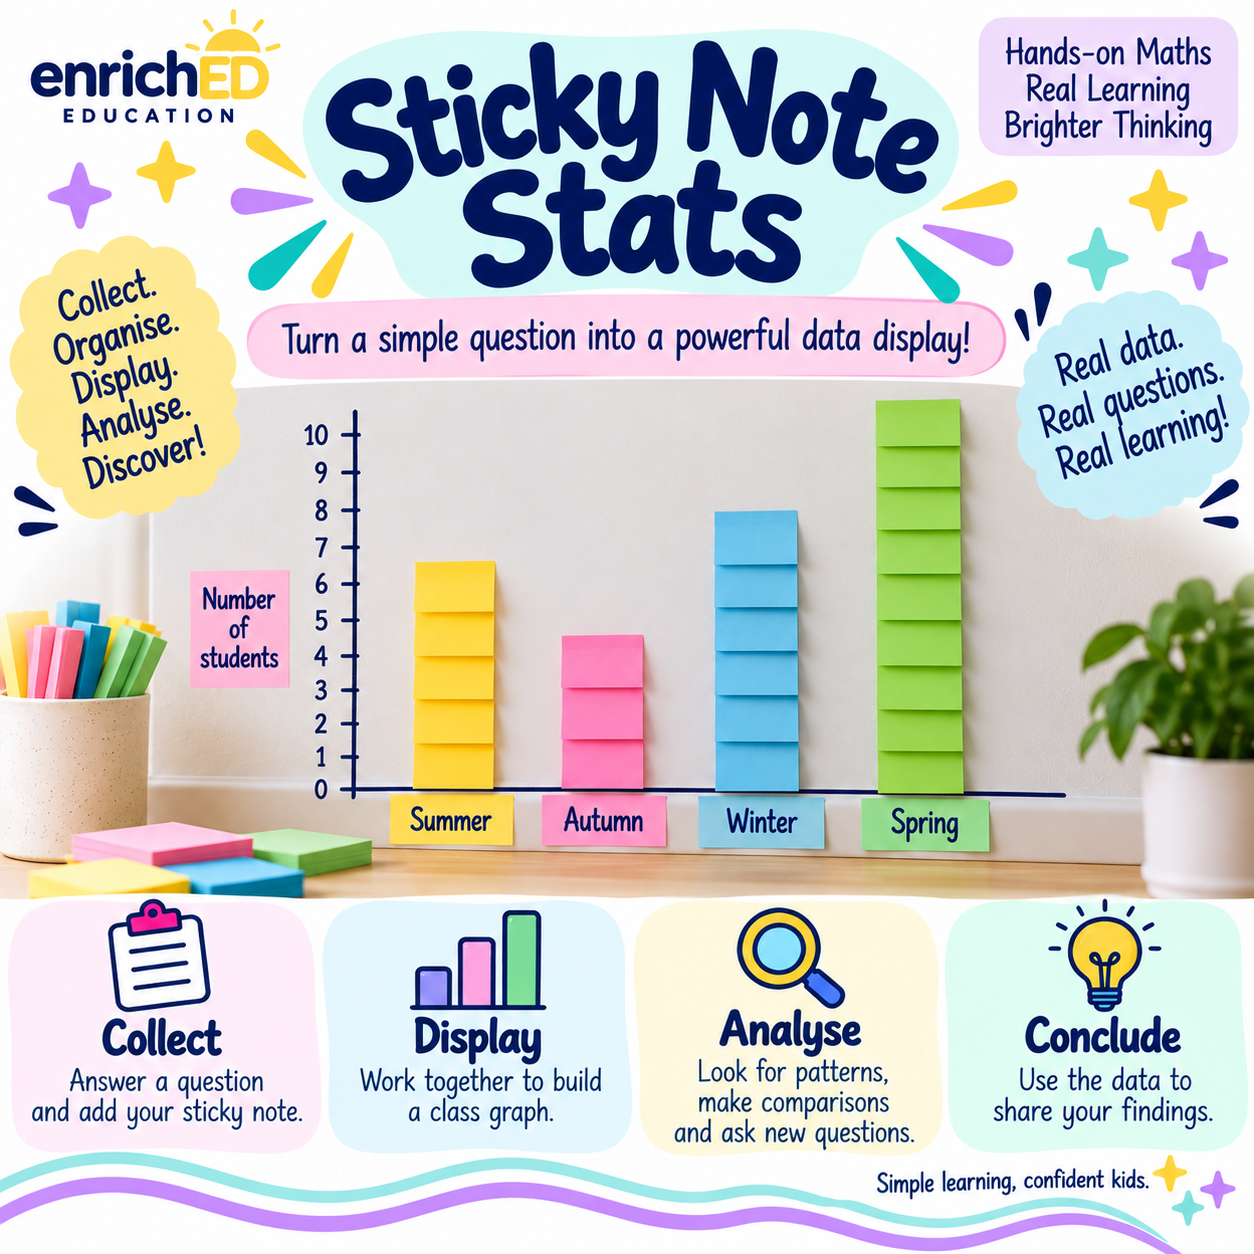
A hands-on maths investigation that turns a simple class question into a powerful data display.
Students work together to collect categorical data and create a large-scale class graph using sticky notes. They then become data detectives, analysing and comparing categories, answering questions, exploring fractions and percentages, representing the data in different ways and using evidence to draw conclusions.
Students will:
pose a question and collect categorical data
organise and display data using a large-scale sticky note graph
read, compare and interpret data
identify patterns and differences between categories
explore data using fractions and percentages
represent data in different ways
use evidence to answer questions and draw conclusions
What’s included:
Learning Intentions and Success Criteria
step-by-step instructions for creating a human-sized sticky note graph
suggested class questions and worked example
Data Detective Challenge
comparison and calculation questions
investigation and “what if?” scenarios
extension challenges
tally table and graphing activity
analysis and conclusion prompts
4-page printable PDF digital download.
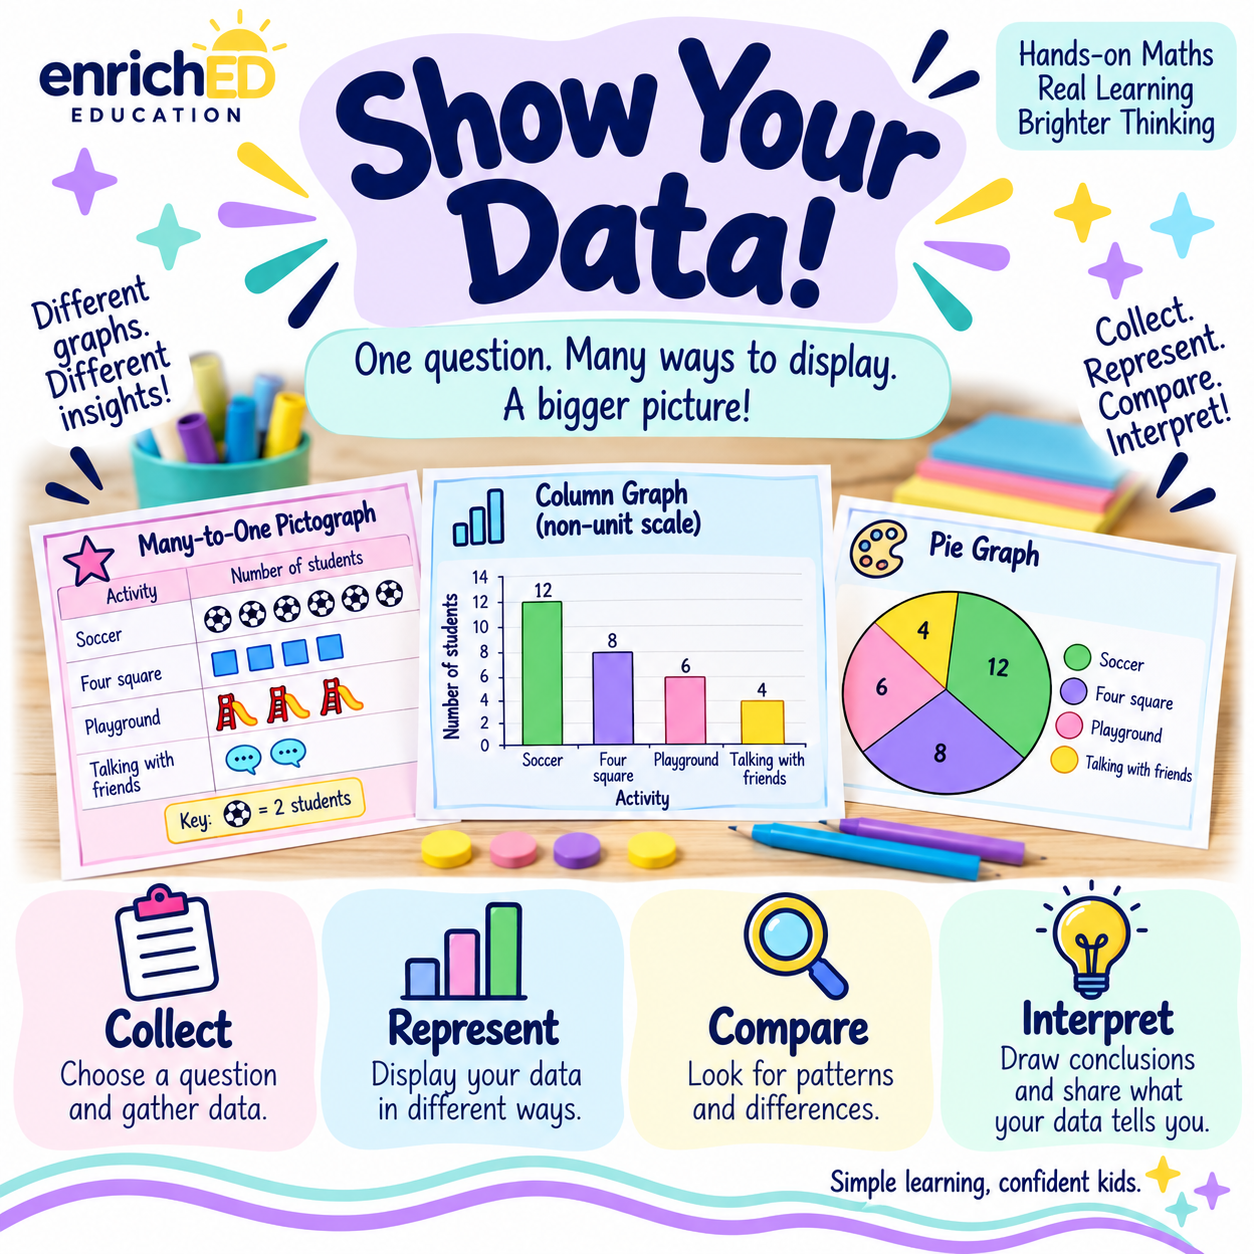
An open-ended maths investigation that helps students collect, represent, compare and interpret data.
Students begin with their own question and collect categorical data before representing the same dataset in different ways. They create a many-to-one pictograph and a column graph using a non-unit scale, then choose another representation to show their data in a different way. Students compare their representations, identify what the data tells them and draw conclusions.
Students will:
pose a question and collect categorical data
organise data using tallies and totals
create a many-to-one pictograph using an appropriate key
create a column graph using a non-unit scale
represent the same data in different ways
compare representations and identify patterns
interpret data and draw conclusions
What’s included:
worked example using one dataset represented in multiple ways
data collection table
many-to-one pictograph activity
non-unit scale column graph
open-ended alternative data representation
data interpretation and reflection prompts
colour student worksheets
printer-friendly black-and-white worksheets
5-page printable PDF digital download.